Reports
Overview
The Reports screen provides access to all standard financial statements and analytical reports for the client’s accounting file. Reports pull live data directly from the ledger and reflect the current state of the books as of the date range selected. Every report supports date range selection, comparison period columns, and cash vs. accrual toggle (for applicable reports). Completed reports can be exported as CSV or PDF for client delivery, CRA submission support, or year-end working paper files.
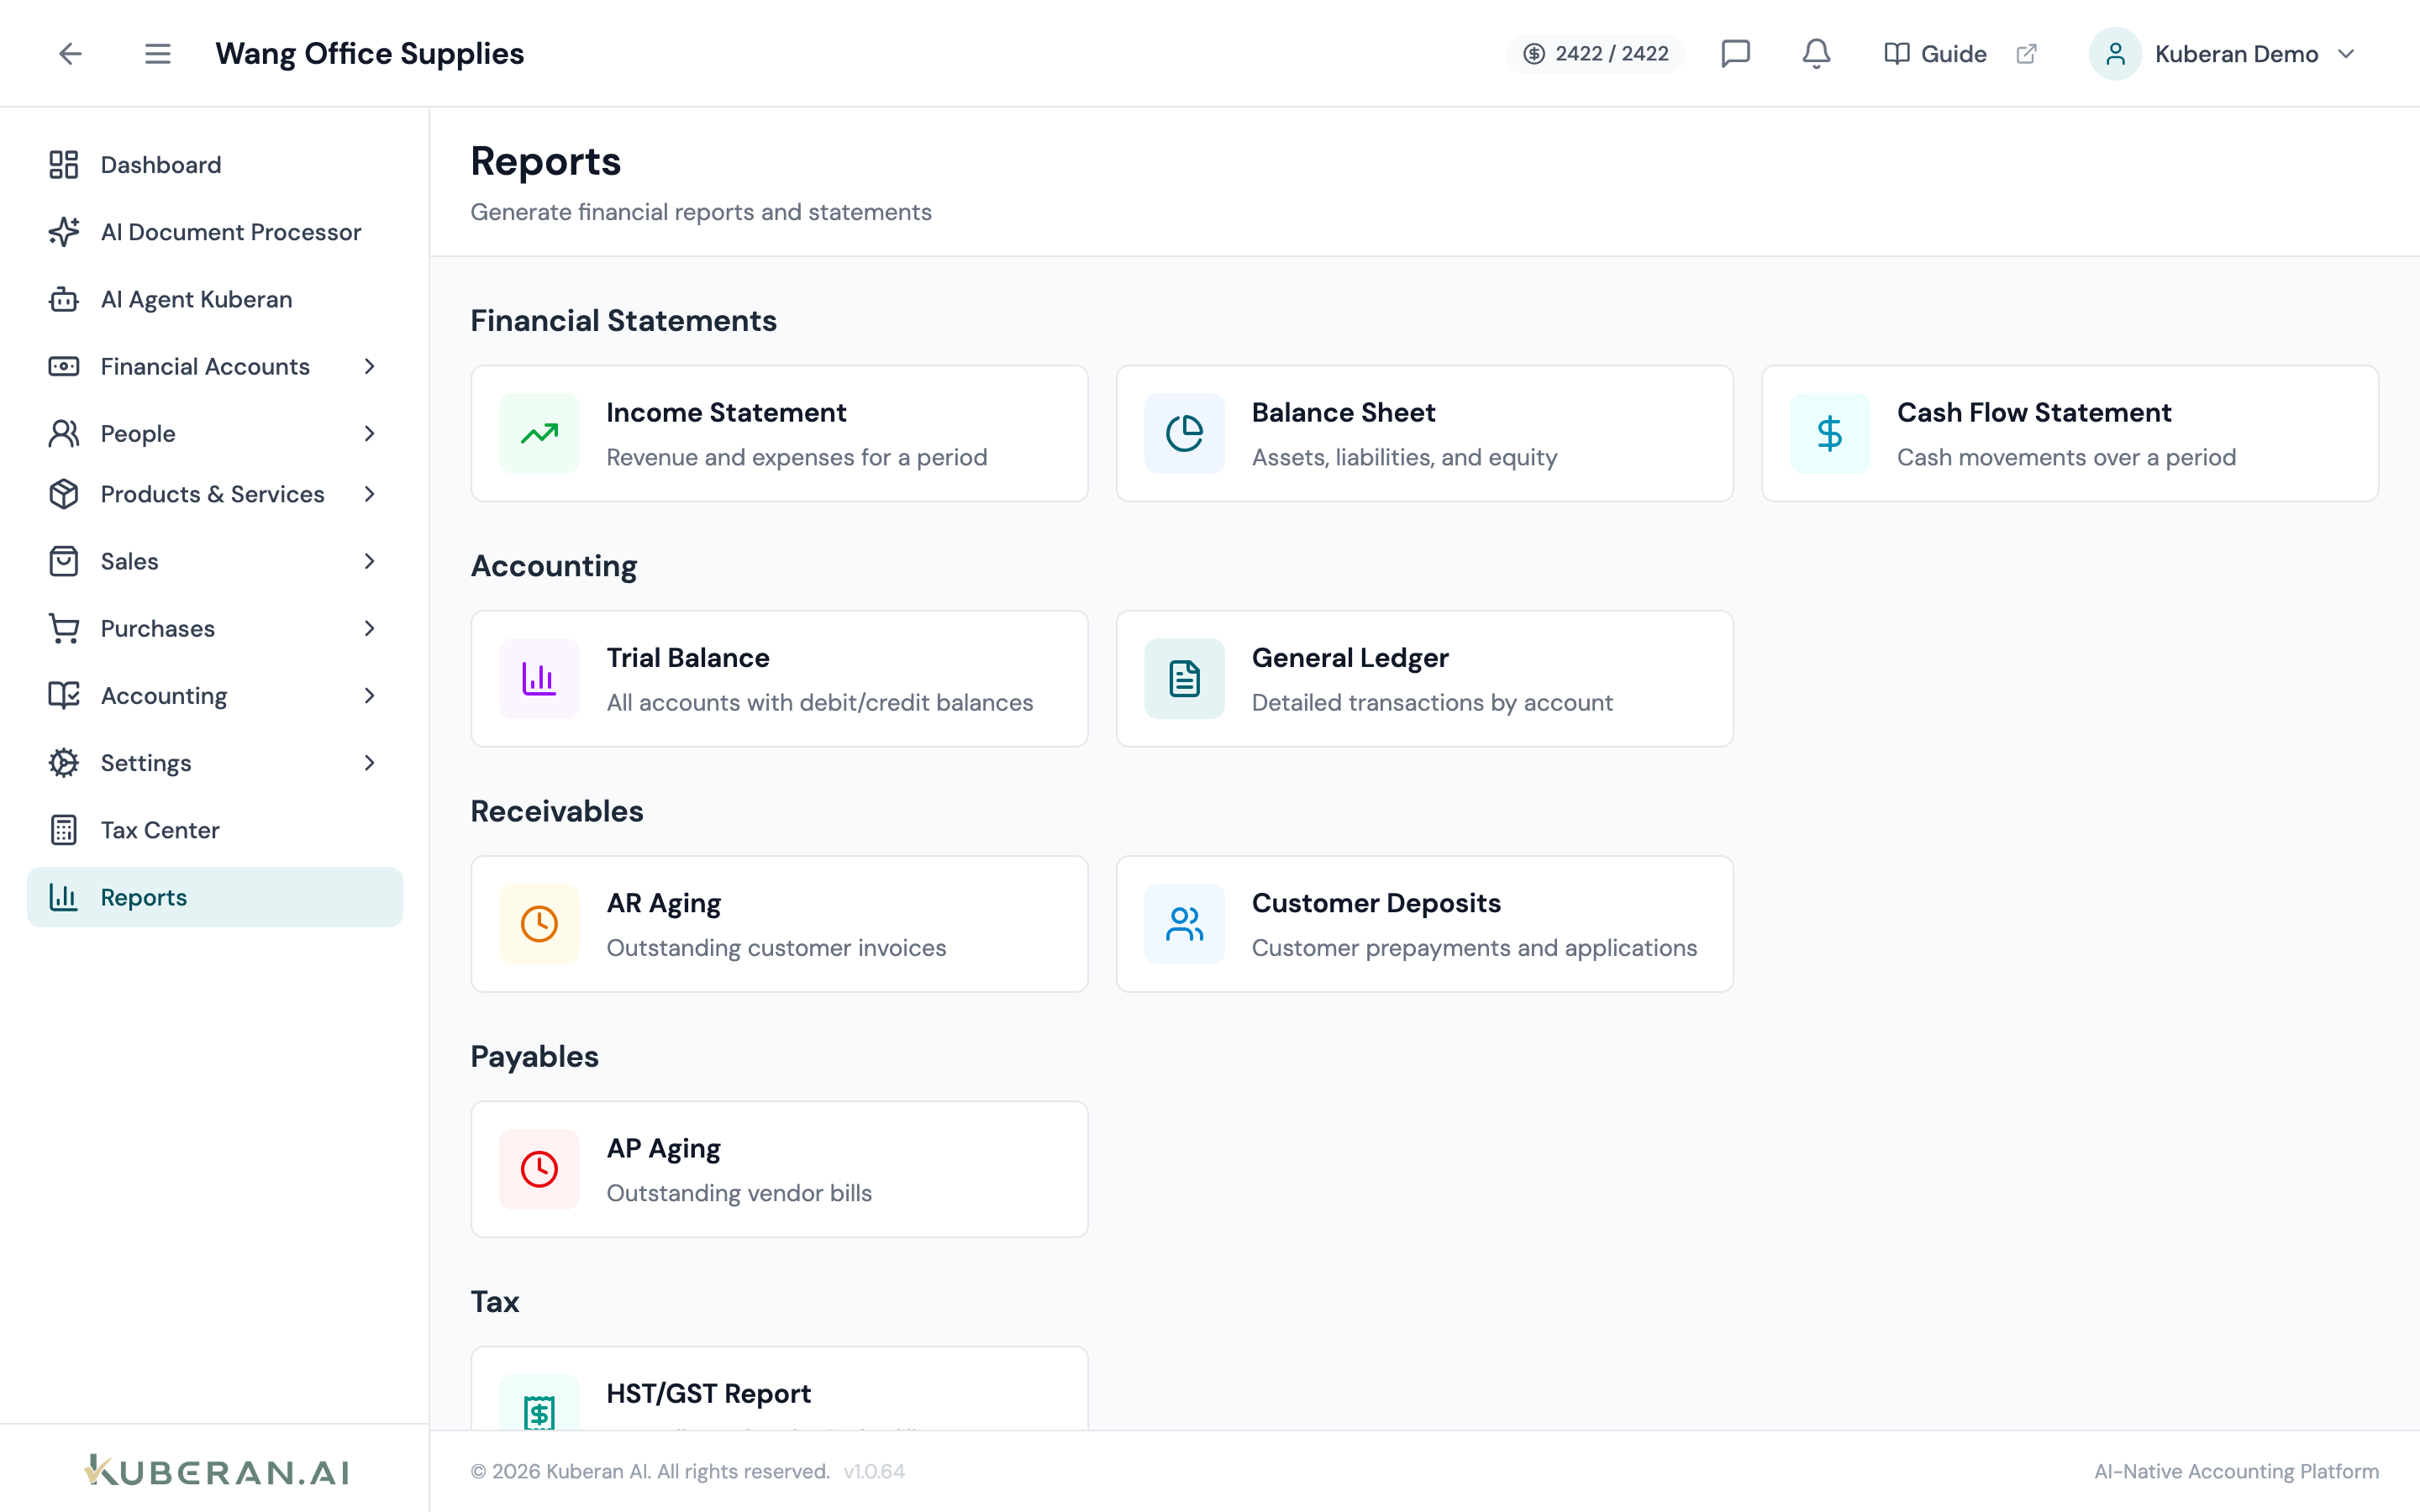
- (1) Report categories — Financial Statements, Receivables, Payables, Sales, Tax
- (2) Date range picker — set the reporting period
- (3) Comparison period toggle — add a prior period column
- (4) Cash / Accrual toggle — switch the accounting basis for applicable reports
- (5) Export buttons — download as PDF or CSV
Available Reports
Financial Statements
Profit & Loss (Income Statement)
Shows revenue, cost of goods sold, gross profit, operating expenses, and net income for the selected period. The standard report for client meetings and year-end tax preparation. The Cost of Goods Sold section includes the COGS entries posted automatically when inventory-tracked items are sold (accrual basis), so gross profit is correct without a manual year-end inventory adjustment.
Options: Date range, comparison period (prior month, prior quarter, prior year), cash vs. accrual basis, show account numbers, show sub-accounts (expanded or collapsed).
Balance Sheet
Shows assets, liabilities, and equity at a specific date. Confirms that the accounting equation (Assets = Liabilities + Equity) holds. Used at fiscal year-end and for bank covenant reporting. The Inventory Asset account reflects the value of stock on hand for inventory-tracked items, kept current automatically by purchases and sales.
Options: As-of date, comparison date (prior year same date), show account numbers, expand/collapse sub-accounts.
Cash Flow Statement
Reports cash inflows and outflows classified by operating, investing, and financing activities. Prepared using the indirect method (starts with net income and adjusts for non-cash items and working capital changes).
Options: Date range, comparison period.
Trial Balance
Lists every account with its debit or credit balance at a point in time. Confirms that total debits equal total credits across all accounts. Standard working paper for year-end file preparation.
Options: As-of date, show zero-balance accounts, show account numbers.
General Ledger
The most detailed report: every journal entry line for every account within the date range, presented account by account with running balances. Essential for tracing individual transactions and responding to audit queries.
Options: Date range, account filter (one or all accounts), show journal entry numbers, show source transaction type.
Receivables
Accounts Receivable Aging
Groups outstanding invoices by ageing bucket: Current, 1–30 days overdue, 31–60 days, 61–90 days, and 91+ days. Essential for collections follow-up and credit risk assessment.
Options: As-of date, customer filter, show invoices or summaries by customer.
Sales by Customer
Summarises total sales revenue by customer for the selected period. Helps identify the client’s most significant revenue sources and seasonal patterns.
Options: Date range, include or exclude tax, group by customer or item.
Payables
Accounts Payable Aging
Groups outstanding bills by ageing bucket. Mirrors the AR Aging structure for the payables side. Used to manage vendor payment prioritisation and cash flow planning.
Options: As-of date, vendor filter.
Expenses by Vendor
Summarises total expenditure by vendor for the period. Useful for identifying the client’s largest cost suppliers and for T4A eligibility review at year-end.
Options: Date range, vendor filter, show or exclude GST/HST.
Tax
GST/HST Summary
Transaction-level breakdown of all GST/HST collected (Line 103) and all Input Tax Credits claimed (Line 106) for a reporting period. Each row shows the transaction date, payee/customer, transaction type, and the GST/HST amount.
Options: Period (aligned to the client’s CRA filing frequency), export to CRA-ready format.
GIFI Summary
A trial balance grouped by CRA RC4088 GIFI line rather than by individual account — the structure tax software expects for a T2 (corporate) or T2125 (self-employment) return. Each row shows the GIFI code, its CRA label, and the aggregated debit and credit totals for every account mapped to that code as of the selected date.
Accounts that do not yet have a GIFI code mapped are grouped into a pinned “Unmapped” row with a count, so you can see at a glance how much of the trial balance would not flow through to the return. Map those accounts in the Chart of Accounts (the Missing GIFI only filter there lists exactly which ones) and re-run the report. Click any GIFI line to drill down to the contributing accounts and transactions.
Options: As-of date, accounting basis, CSV export (the CSV includes a Net Amount column formatted for pasting directly into tax-preparation software).
Common Report Controls
Start and end dates for the report. Quick presets: This Month, Last Month, This Quarter, Last Quarter, This Year, Last Year, Custom.
Adds a second column to the report showing figures for the prior period (e.g., prior month or prior year). The variance and percentage change are calculated automatically.
Available on the Profit & Loss and Cash Flow reports. Cash basis recognises revenue when received and expenses when paid; Accrual basis recognises them when earned/incurred. This setting applies only to the report view — it does not change the underlying transactions.
For hierarchical reports (P&L, Balance Sheet), toggles between showing individual sub-accounts and showing only parent account totals.
Downloads the report data as a comma-separated values file. Suitable for importing into Excel, working papers, or tax preparation software.
Generates a formatted PDF with the client name, fiscal year, and report date in the header. Suitable for direct delivery to the client or inclusion in a working paper binder.
Actions
Generate a Report
- Navigate to Reports for the client.
- Select the report category from the left sidebar (e.g., Financial Statements, Receivables).
- Click the report name (e.g., Profit & Loss).
- Set the Date Range using the quick presets or the custom date pickers.
- Toggle Comparison Period on or off as needed.
- For the P&L and Cash Flow reports, select the Accounting Basis (Cash or Accrual).
- Click Run Report. The report renders inline within a few seconds.
- Drill into any line by clicking the amount — a detail list of the contributing transactions opens in a side panel.
Export a Report
- With the report rendered, click Export PDF or Export CSV in the top-right of the report view.
- For PDF, a preview dialogue shows the formatted document. Click Download to save.
- For CSV, the file downloads immediately.
Related
- Chart of Accounts — Account hierarchy determines report structure
- Periods — Close periods before generating year-end reports
- Tax Centre — GST/HST Summary report ties to the tax filing workflow
- Journal Entries — Post adjusting entries to ensure reports are accurate before distribution
- Inventory Accounting — Why COGS and Inventory Asset move automatically on the P&L and Balance Sheet