Portal Admin — Dashboard
Overview
The Portal Admin Dashboard gives your practice a real-time view of client portal activity across all clients. The portal is the client-facing side of Kuberan AI — where clients log in to view invoices, upload documents, send messages, and book appointments. The dashboard shows you how many portals are active, what is pending attention, and a feed of recent portal activity so you can respond quickly to client actions.
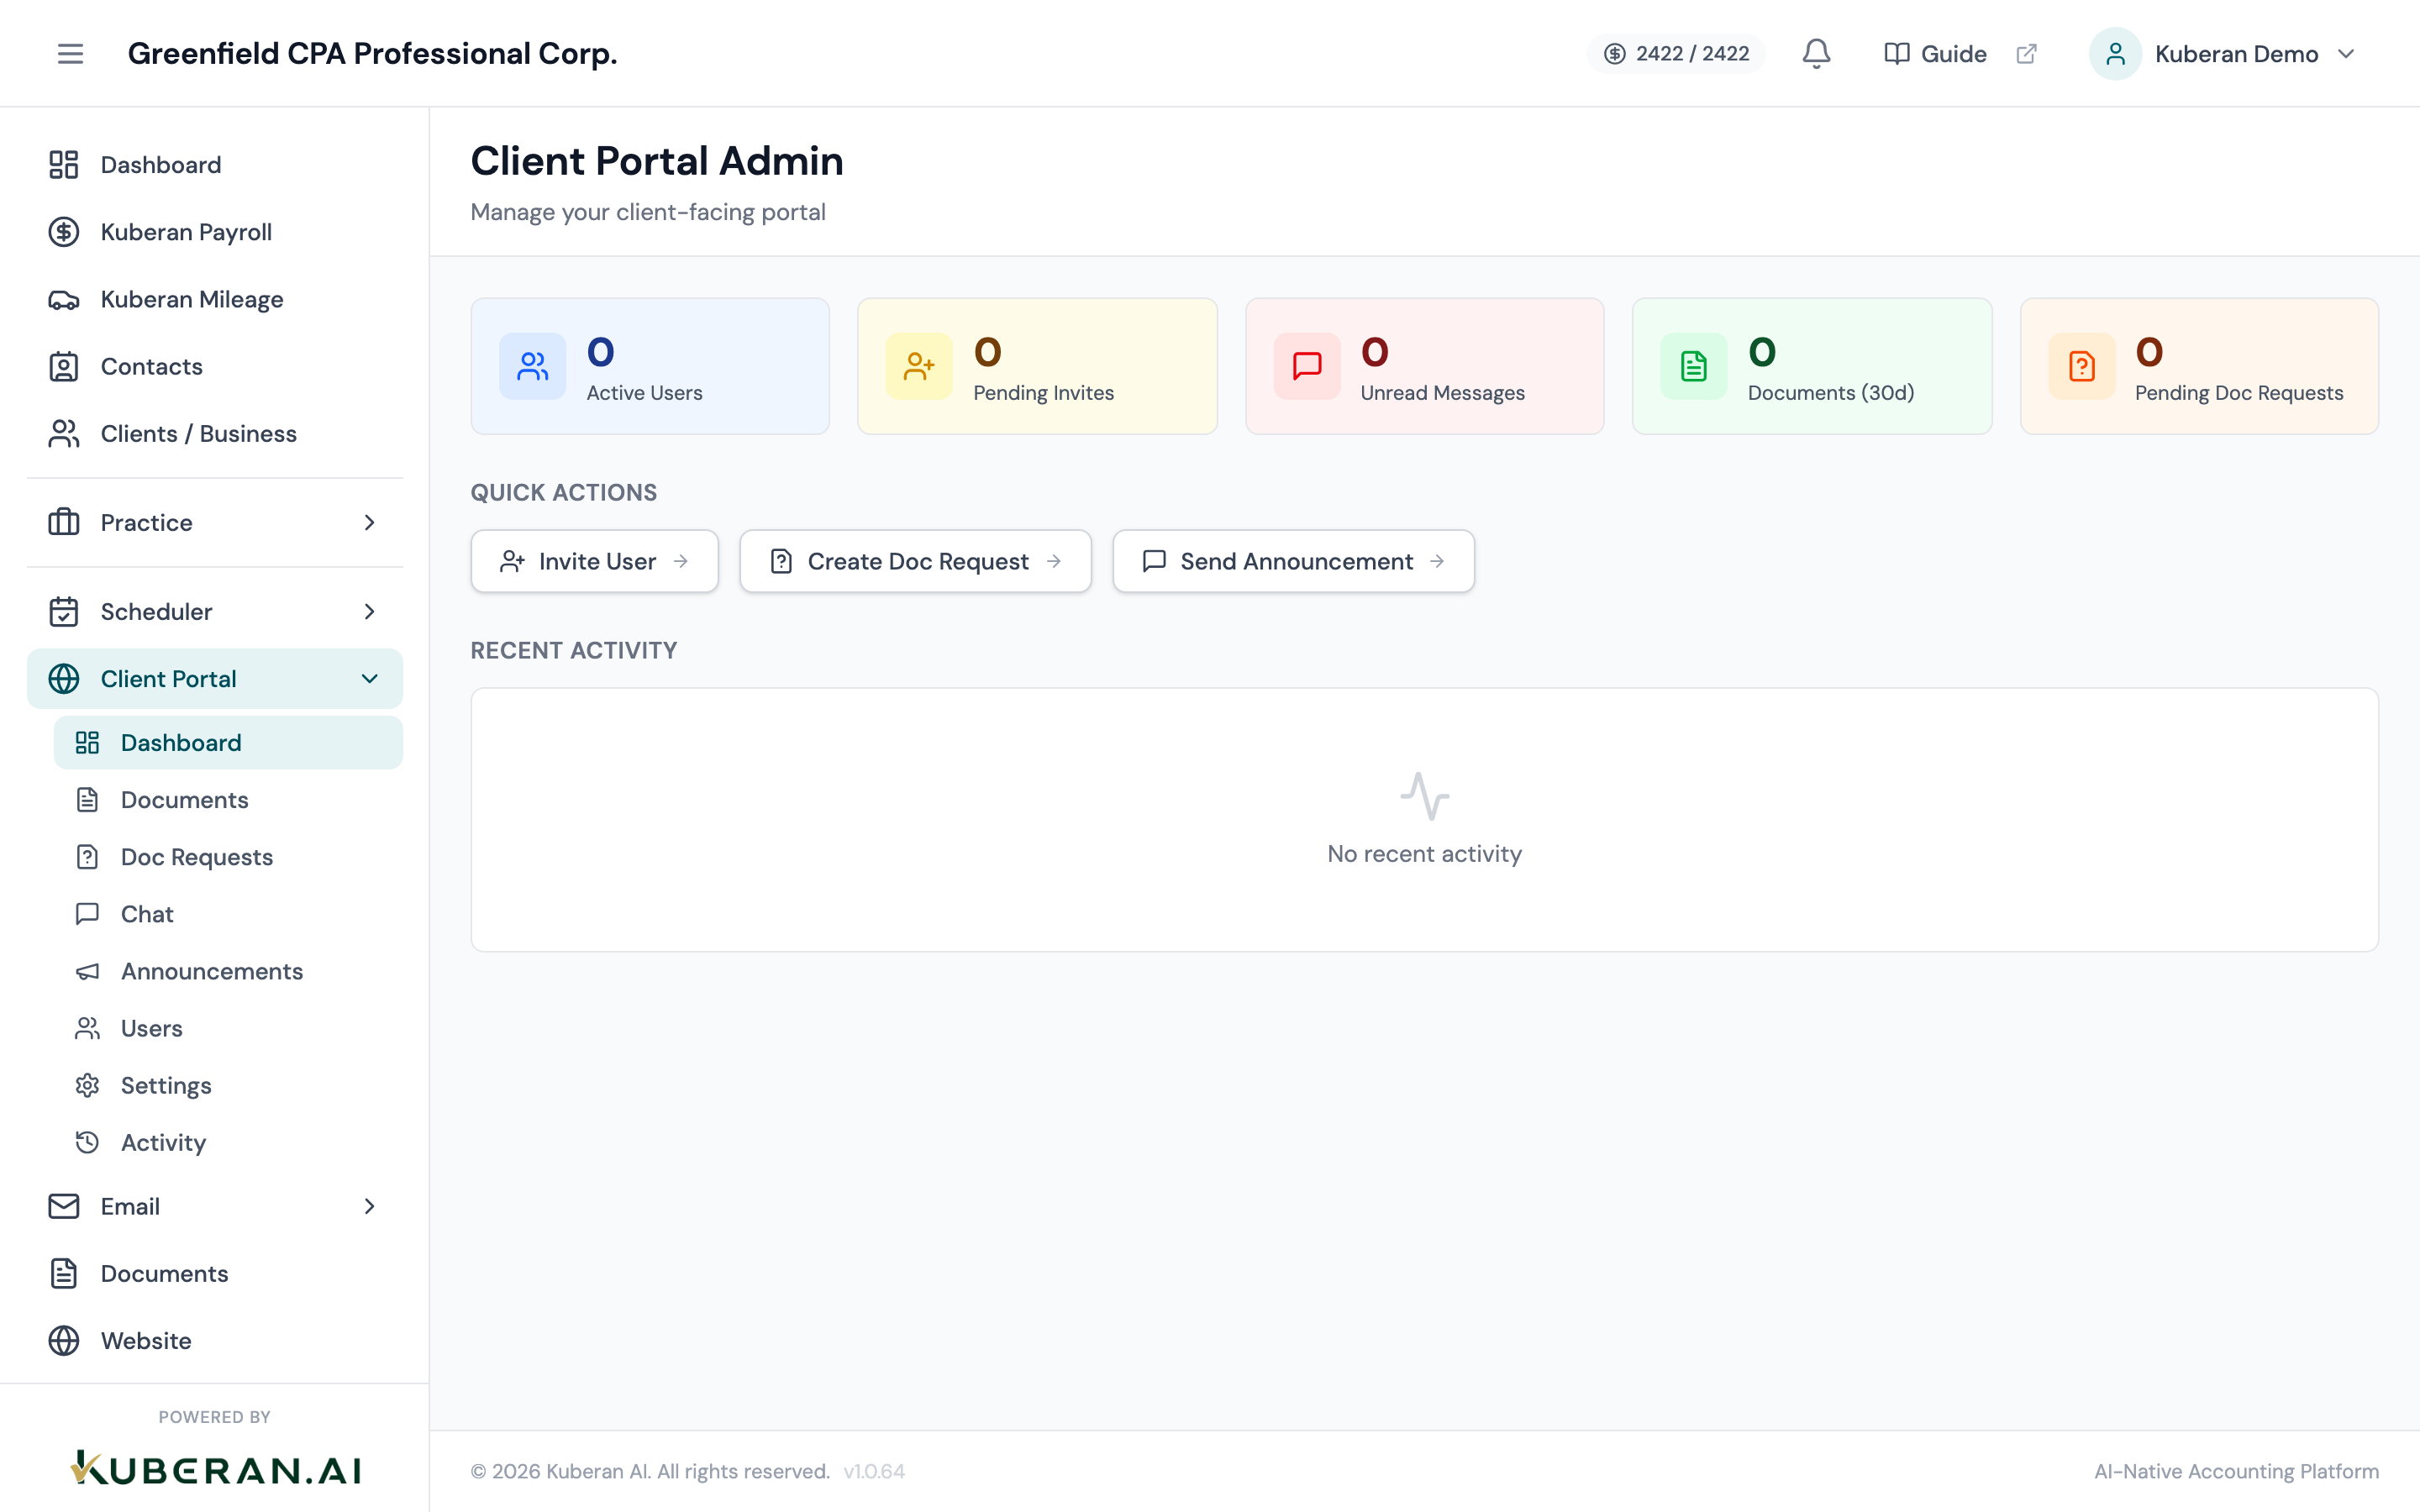
- (1) Active Portals card — count of clients with portal access enabled
- (2) Pending Requests card — document requests awaiting client action
- (3) Unread Messages card — unread portal chat messages
- (4) Recent Activity feed — timestamped portal events
Screen Layout
Summary cards (top row): Four cards giving headline metrics at a glance.
Recent Activity feed (below cards): A reverse-chronological list of portal events from all active portals.
Summary Cards
Active Portals
The total number of clients who have at least one active portal user (a contact with valid login credentials and active portal access). A client with multiple portal users still counts as one active portal. Click the card to jump to the Portal Users list.
Clients without any portal users do not appear in portal activity. The number here gives you a sense of what proportion of your client base is using self-service features.
Pending Requests
The total count of document requests currently in Pending or Partial status — meaning they have been sent to clients but are not yet fully complete. This number includes requests that are overdue. Click the card to jump to the Document Requests list filtered to outstanding requests.
Unread Messages
The number of unread chat messages from clients across all portal conversations. Click the card to jump to the Portal Chat screen. This count updates in real time as clients send messages.
Recent Activity Count
The total number of portal events in the past seven days — logins, document uploads, invoice views, chat messages, and appointment bookings. This is a measure of portal engagement across your client base. A trend arrow shows whether activity is up or down compared to the previous seven days.
Recent Activity Feed
The feed shows the 50 most recent events from all active client portals, in reverse chronological order. Each event entry shows:
- Event type — e.g., “Document Uploaded,” “Invoice Viewed,” “Message Sent,” “Appointment Booked”
- Client — the client whose portal generated the event, with a link to their record
- User — the portal user who performed the action (the client’s name)
- Timestamp — how long ago the event occurred (e.g., “45 minutes ago”)
Opens the full portal activity log, which is filterable by client, event type, user, and date range. Useful for auditing portal usage or investigating a specific client’s activity.
Navigating Portal Admin
The Portal Admin section has five sub-pages accessible from the left sidebar:
| Page | Purpose |
|---|---|
| Dashboard | This page — overview metrics and recent activity |
| Users | Manage portal login access for clients |
| Announcements | Create and publish messages to client portals |
| Chat | Respond to client messages in the portal chat |
| Settings | Configure portal appearance and enabled features |
Tips
- Monitor unread messages daily. Clients use the portal chat as a primary communication channel and expect timely responses. A high unread count is a signal to assign conversations to team members or increase monitoring frequency.
- Pending Requests during tax season will typically be high. Focus on overdue requests — filter the Document Requests list by Overdue to prioritise follow-ups.
- Activity trend on the fourth card is a useful way to gauge whether your practice’s portal adoption is growing over time. Share this metric with your team as a health indicator.